
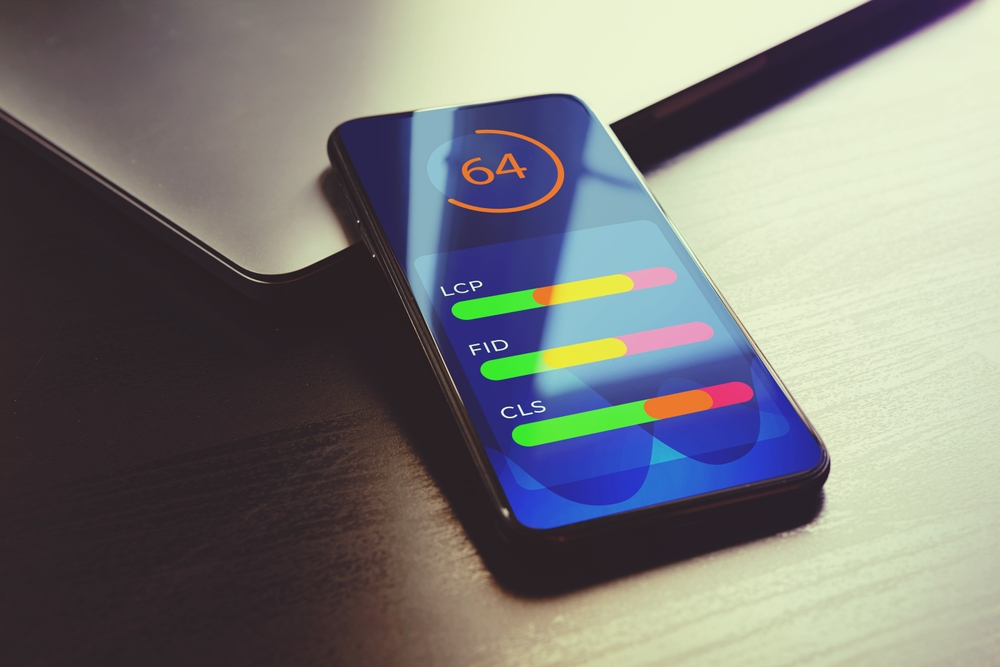
Core Web Vitals are performance metrics of Google’s Page Experience which employ to gauge user experience. The visual measure metrics offer visual stability with Cumulative Layout Shift (CLS), interaction with First Input Delay (FID), and Largest Contentful Paint (LCP). For the past few years, ranking pages have used Core Web Vital metrics, and Mobile page experience uses. The simplest way to oversee the important data for your website is to employ Core Web Vitals in Google Search Console. With the report, you can figure out the performance of your URL, and whether it is performing well or needs any improvements. Core Web Vital is more related to digital marketing. That’s why before measuring the performance of your URL, try to know the role of core web vitals in SEO services.
What are Core Web Vitals?
Developers use Core Web Vitals to see how users interact with a website. These are Google’s collection of standardized metrics. Core Web Vitals are the best tools for website owners. With the help of these tools, they can make an accurate report of a user’s real-world experience.
Core Web Vitals makes a statistic for the following three major factors of the user experience issues:
- Ease of interaction
- Performance of page loading
- Stabilizing the visual of a page according to the perspective of users.
These independent measurements help break down the several variables into smaller chunks. Therefore, website owners may find and correct technical problems throughout their entire website. This practice is important when developers need to consider “user experience” from a comprehensive point of view.
Make sure you save these crucial metrics and do not provide a complete picture of the user experience on a website. However, developers can use every single piece of metric for troubleshooting. This is the most organized and efficient way to fix issues in URLs.
Furthermore, there are three significant metrics of Core Web Vitals that you can use to excel your website performance.
Cumulative Layout Shift (CLS)
To accelerate conversions and sales, website owners try to make it as simple as possible for visitors to navigate across the entire site. To find buttons and links that change after every web page, developers use Cumulative Layout Shifts. It also simplifies the most challenging phases of users’ experiences while you try to engage users with website features. All this can be done once you render the page and make the website live.
For a better user experience, you need to focus on design and UI/UX. If the design is bland and the buttons are not placed in the correct position, the user will never explore your entire website. To Boost accessibility, increase sales, and encourage click-through rates, website owners use CLS. It helps developers know whether links and images move responsively on the page.
What does CLS measure?
CLS calculates if components in the visible viewport change in relation to their initial position between two rendered frames. In other words, this indicator helps website owners whether banners, buttons, and text are moved around or not. These things matter a lot while a visitor is viewing material on a specific page.
After the page loads on a device of the user, it’s crucial to make sure all content remains in the right place. Components that change position can confuse users and affect their experience on a page. By taking into account a number of variables, CLS analyzes core metrics to assess a page’s visual stability from the user’s point of view.
Some of the core metric factors are:
- Distance fraction
- Layout shift
- Impact fraction
Largest Contentful Paint (LCP)
Core Web Vitals statistics are also known as the Largest Contentful Paint. Website owners can use it to evaluate user experience. Additionally, it helps to determine a helpful page based on the render time of the giant blocks visible to an audience.
Every business desires its website to load quickly and provide an engaging user experience to the audience. The load time does not only enhance the user experience, but it also lists the page on the top google ranking. Slow load time will kill user engagement and decrease the ratio of conversions. Furthermore, you will lose nothing less than nothing with a slow load time.
What does LCP measure?
Largest Contentful Paint (LCP) measures how quickly various content blocks load in the user viewport on their current screen. This metric does not take into account information below the fold. Furthermore, it informs you of the rendering time of content sections on the visible screen.
The major considerations of LCP are:
- Block-level text
- Background images
- Images
- Video poster images
First Input Delay (FID)
Only responsive and snappy pages grab the interest of visitors. First, Input Delay measures the latency rate of the website. Latency means the time a website takes to respond to users’ activity. With the help of this tool, you can even check any individual page that affects user engagement.
To present content to visitors current websites use a wide rank of dynamic content tools and advanced technologies. Although this kind of content can enhance content deployment. Some users might face delays, and this may happen due to slow internet or their browser.
Before making the website, live developers need to make the site responsive to reduce the wait time. This practice will increase user engagement and usability of the website.
What does FID measure?
First Input Delay (FID) measures the responsiveness of every page of websites. The tool can tell you the time a website takes to respond to the user when they send any command. In other words, FID tracks the time of user’s activity like typing and clicks.
The ideal time to respond is 100 milliseconds. Every website owner should maintain this to maintain a good user experience.
However, using the FID could be challenging for measurements. The reason behind this is that it measures the data in small fields. This implies factors that are not in your control will affect your score. For instance, the internet speed and the device strength of your users could impact user experience.
Also Read: The Ultimate Buyer’s Guide to Choosing the Best Surround Sound Speaker System
Quick facts about Core Web Vitals
Fact 1
A major chunk of information comes from the Chrome User Experience (CrUX). It collects information from users of Chrome who have participated in the event. At the 75th percentage of users, the metrics will be evaluated. Even if 5% of your users are in the “require improvement” group, 70% of your users fall into the “good” category. However, the website page will still be given the “need improvement” tag.
Fact 2
LCP and FID are two significant metrics that do not track through page transitions in Single Page Applications. It’s also possible that the “Responsiveness” metric, which is utilized to measure interaction, would also fluctuate. However, the plan modifications are App History API.
Fact 3
Each page’s stats will be evaluated. However, Google Webmaster Trends Analyst Expert claims that signals from other areas of a website or a complete site may be used if there needs to be more data. With more than 42 million pages, only 11.4% use Core Web Vitals data.
Fact 4
The metrics are divided between mobile and desktop. Desktop signals are made for desktop ranking, whereas mobile signals are utilized for mobile rankings.